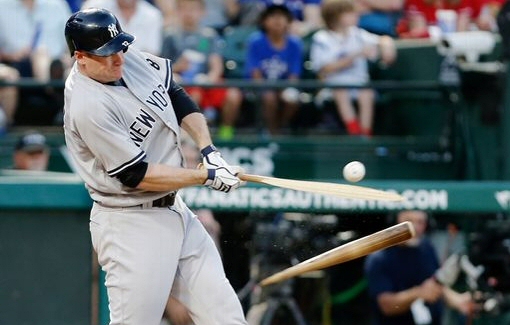
Chase Headley has been really crapped on by most Yankee fans on Twitter for the last month. There have been some defending him. His average had sunk to .150 and he hasn’t gotten an extra base hit yet this year.
But his defense has been good, this throws to first base solid this year, and he’s gotten a hit in each of the last two games, raising his still-horrific batting average to .156. He’s only come up 64 times this year so far, all in April; today is the first game in May.
Odds are Headley will hit 10-12 homeruns this year and bat .260 or so. Not bad for a great defensive third baseman in the post-steroid, no-hitting-across-the-league era.
Lifetime Averages
Headley has come up over 4,100 times in his career entering this year. He’s 32. His lifetime batting average is .263 and his On Base Percentage (OBP) is .343. He has over 100 homers in those 4,100 at bats, meaning he’ll give you 10 homers per 410 at bats.
Comparatively, Brett Gardner, also 32 — has come up just over 3,100 times. His lifetime avg is .263 with an OBP of .346.
Chase Headley:
| Year | Age | Tm | G | AB | R | H | HR | RBI | SB | |||
|---|---|---|---|---|---|---|---|---|---|---|---|---|
| 2007 | 23 | SDP | 8 | 18 | 1 | 4 | 0 | 0 | 0 | .222 | .333 | .278 |
| 2008 | 24 | SDP | 91 | 331 | 34 | 89 | 9 | 38 | 4 | .269 | .337 | .420 |
| 2009 | 25 | SDP | 156 | 543 | 62 | 142 | 12 | 64 | 10 | .262 | .342 | .392 |
| 2010 | 26 | SDP | 161 | 610 | 77 | 161 | 11 | 58 | 17 | .264 | .327 | .375 |
| 2011 | 27 | SDP | 113 | 381 | 43 | 110 | 4 | 44 | 13 | .289 | .374 | .399 |
| 2012 | 28 | SDP | 161 | 604 | 95 | 173 | 31 | 115 | 17 | .286 | .376 | .498 |
| 2013 | 29 | SDP | 141 | 520 | 59 | 130 | 13 | 50 | 8 | .250 | .347 | .400 |
| 2014 | 30 | TOT | 135 | 470 | 55 | 114 | 13 | 49 | 7 | .243 | .328 | .372 |
| 2014 | 30 | SDP | 77 | 279 | 27 | 64 | 7 | 32 | 4 | .229 | .296 | .355 |
| 2014 | 30 | NYY | 58 | 191 | 28 | 50 | 6 | 17 | 3 | .262 | .371 | .398 |
| 2015 | 31 | NYY | 156 | 580 | 74 | 150 | 11 | 62 | 0 | .259 | .324 | .369 |
| 2016 | 32 | NYY | 20 | 64 | 2 | 10 | 0 | 2 | 3 | .156 | .267 | .156 |
| 10 Yrs | 1142 | 4121 | 502 | 1083 | 104 | 482 | 79 | .263 | .343 | .399 | ||
| 162 Game Avg. | 162 | 585 | 71 | 154 | 15 | 68 | 11 | .263 | .343 | .399 | ||
| Year | Age | Tm | G | AB | R | H | HR | RBI | SB | |||
|---|---|---|---|---|---|---|---|---|---|---|---|---|
| 2008 | 24 | NYY | 42 | 127 | 18 | 29 | 0 | 16 | 13 | .228 | .283 | .299 |
| 2009 | 25 | NYY | 108 | 248 | 48 | 67 | 3 | 23 | 26 | .270 | .345 | .379 |
| 2010 | 26 | NYY | 150 | 477 | 97 | 132 | 5 | 47 | 47 | .277 | .383 | .379 |
| 2011 | 27 | NYY | 159 | 510 | 87 | 132 | 7 | 36 | 49 | .259 | .345 | .369 |
| 2012 | 28 | NYY | 16 | 31 | 7 | 10 | 0 | 3 | 2 | .323 | .417 | .387 |
| 2013 | 29 | NYY | 145 | 539 | 81 | 147 | 8 | 52 | 24 | .273 | .344 | .416 |
| 2014 | 30 | NYY | 148 | 555 | 87 | 142 | 17 | 58 | 21 | .256 | .327 | .422 |
| 2015 ★ | 31 | NYY | 151 | 571 | 94 | 148 | 16 | 66 | 20 | .259 | .343 | .399 |
| 2016 | 32 | NYY | 21 | 74 | 11 | 18 | 2 | 5 | 3 | .243 | .364 | .351 |
| 9 Yrs | 940 | 3132 | 530 | 825 | 58 | 306 | 205 | .263 | .346 | .391 | ||
| 162 Game Avg. | 162 | 540 | 91 | 142 | 10 | 53 | 35 | .263 | .346 | .391 | ||


Be the first to comment